
Dashboard
Dashboard
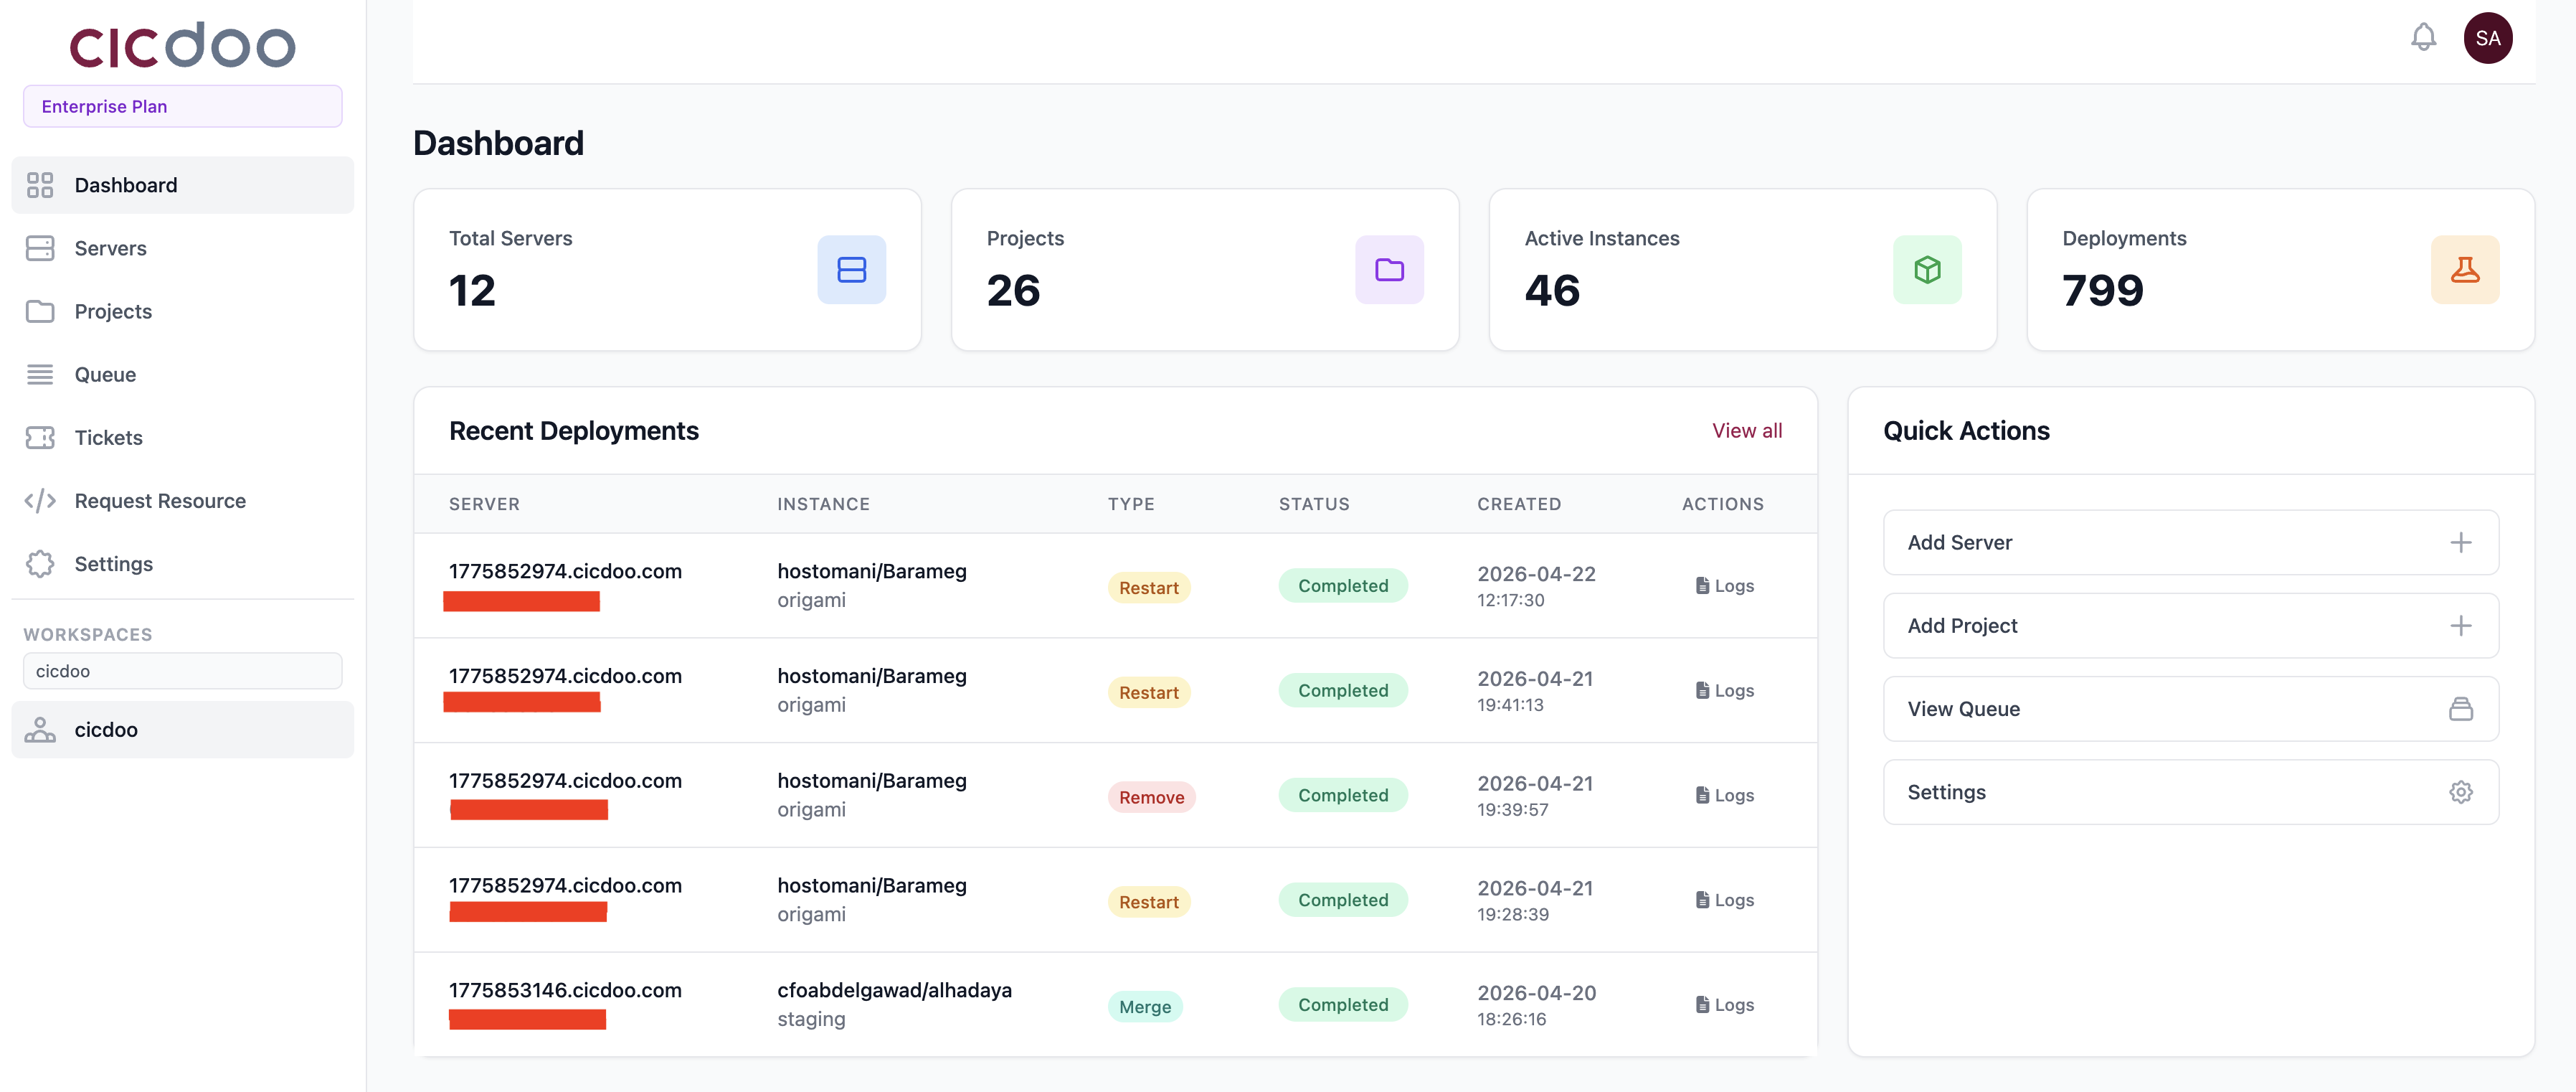
The dashboard is the first screen you see after logging in. It provides a live overview of your platform.
Stats Grid
Four summary tiles at the top of the page show:
| Tile | What it counts |
|---|---|
| Servers | Total registered servers |
| Projects | Total projects under your account |
| Active Instances | Running Odoo environments |
| Deployments | Total deployments processed |
Metrics are color-coded to indicate healthy, warning, or critical states.
Plan Usage Banner
Displays your current plan (e.g., Free) and quota consumption (servers used / limit, projects used / limit). An Upgrade link is shown when you are near or at a limit.
Recent Deployments
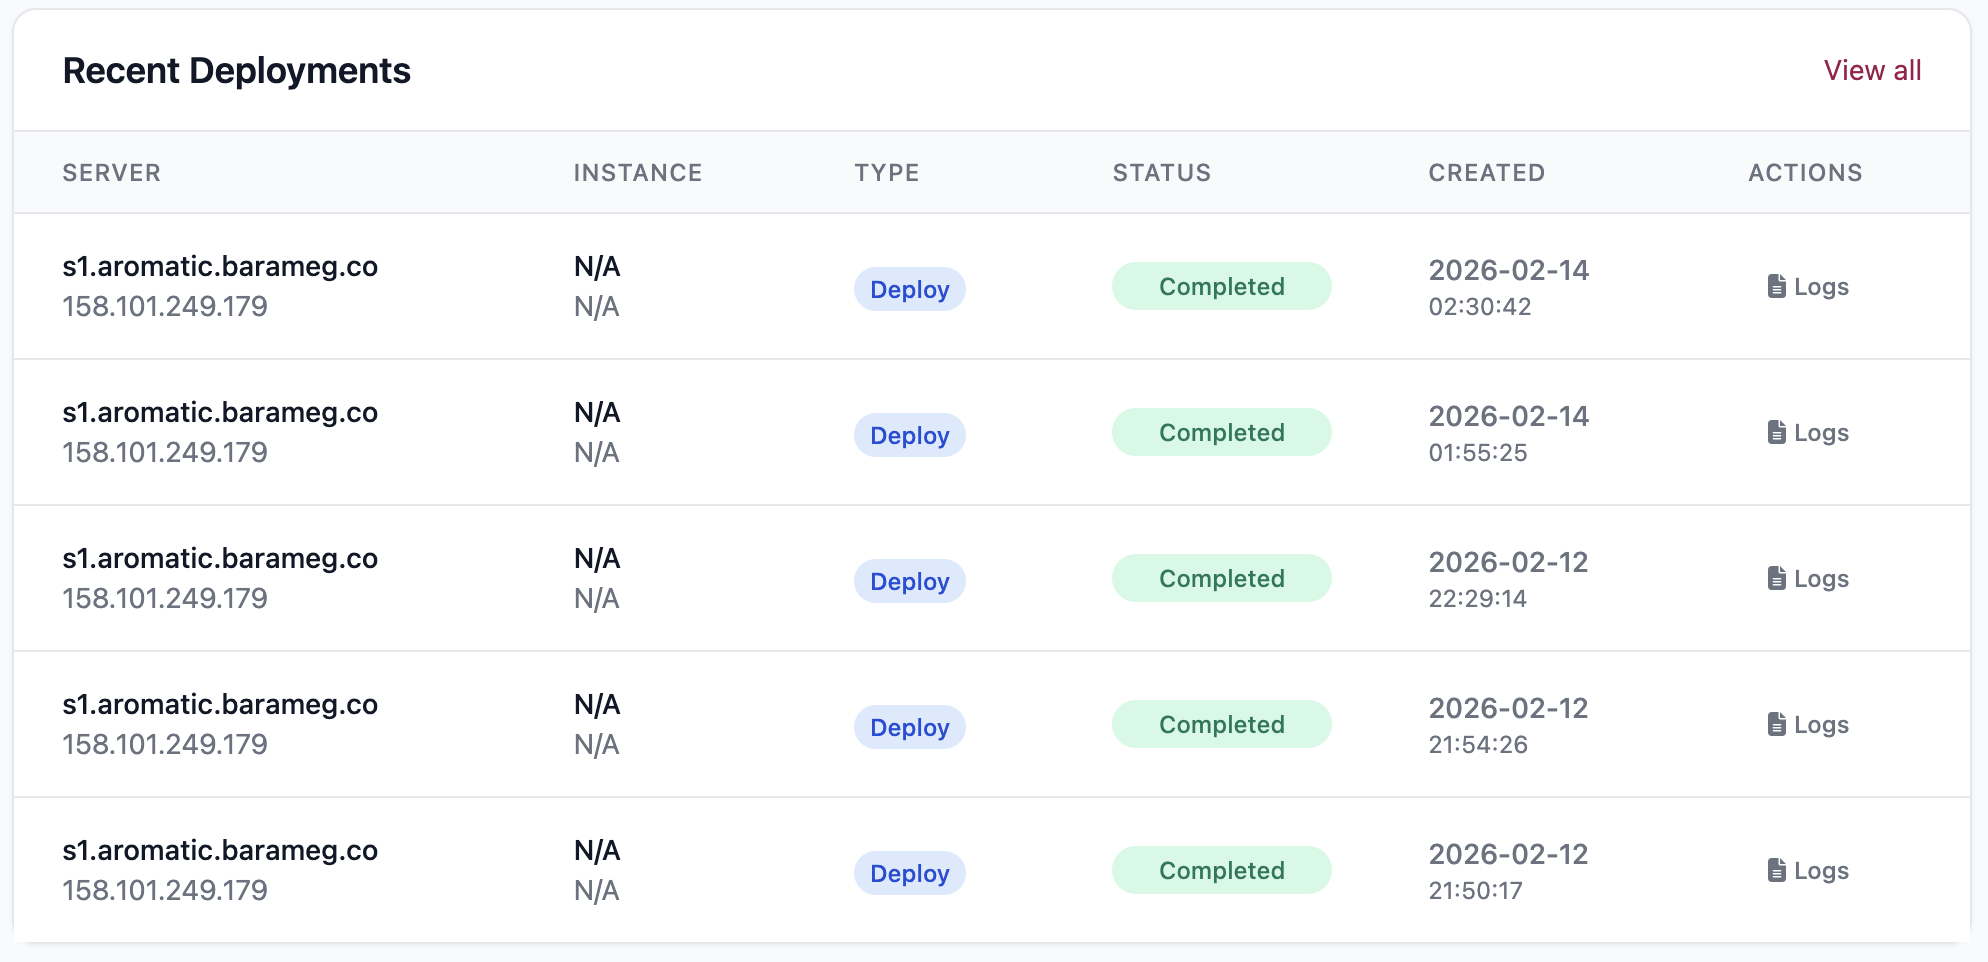
A live-updating table showing the last five queue jobs. The table refreshes automatically every five seconds. Columns include:
- Server name
- Instance name
- Job type (e.g., deploy, restart, backup)
- Status (queued, running, done, failed)
- Initiated by (user name)
- Created time
Click the log icon on any row to open the full deployment log in a modal window.
Quick Actions
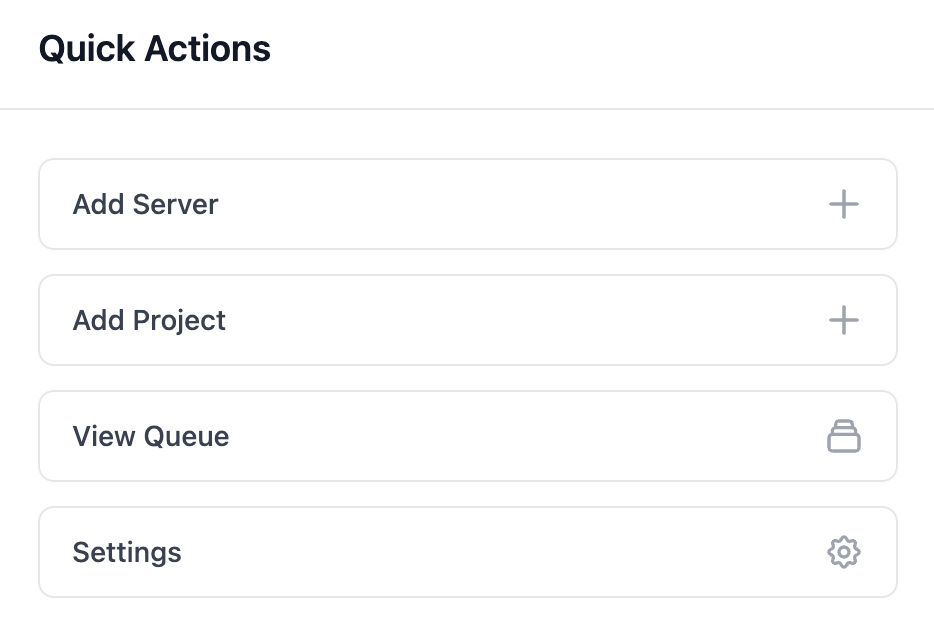
Shortcut buttons for the most common tasks, accessible directly from the dashboard without navigating to a specific resource.
Updated 3 months ago
Did this page help you?